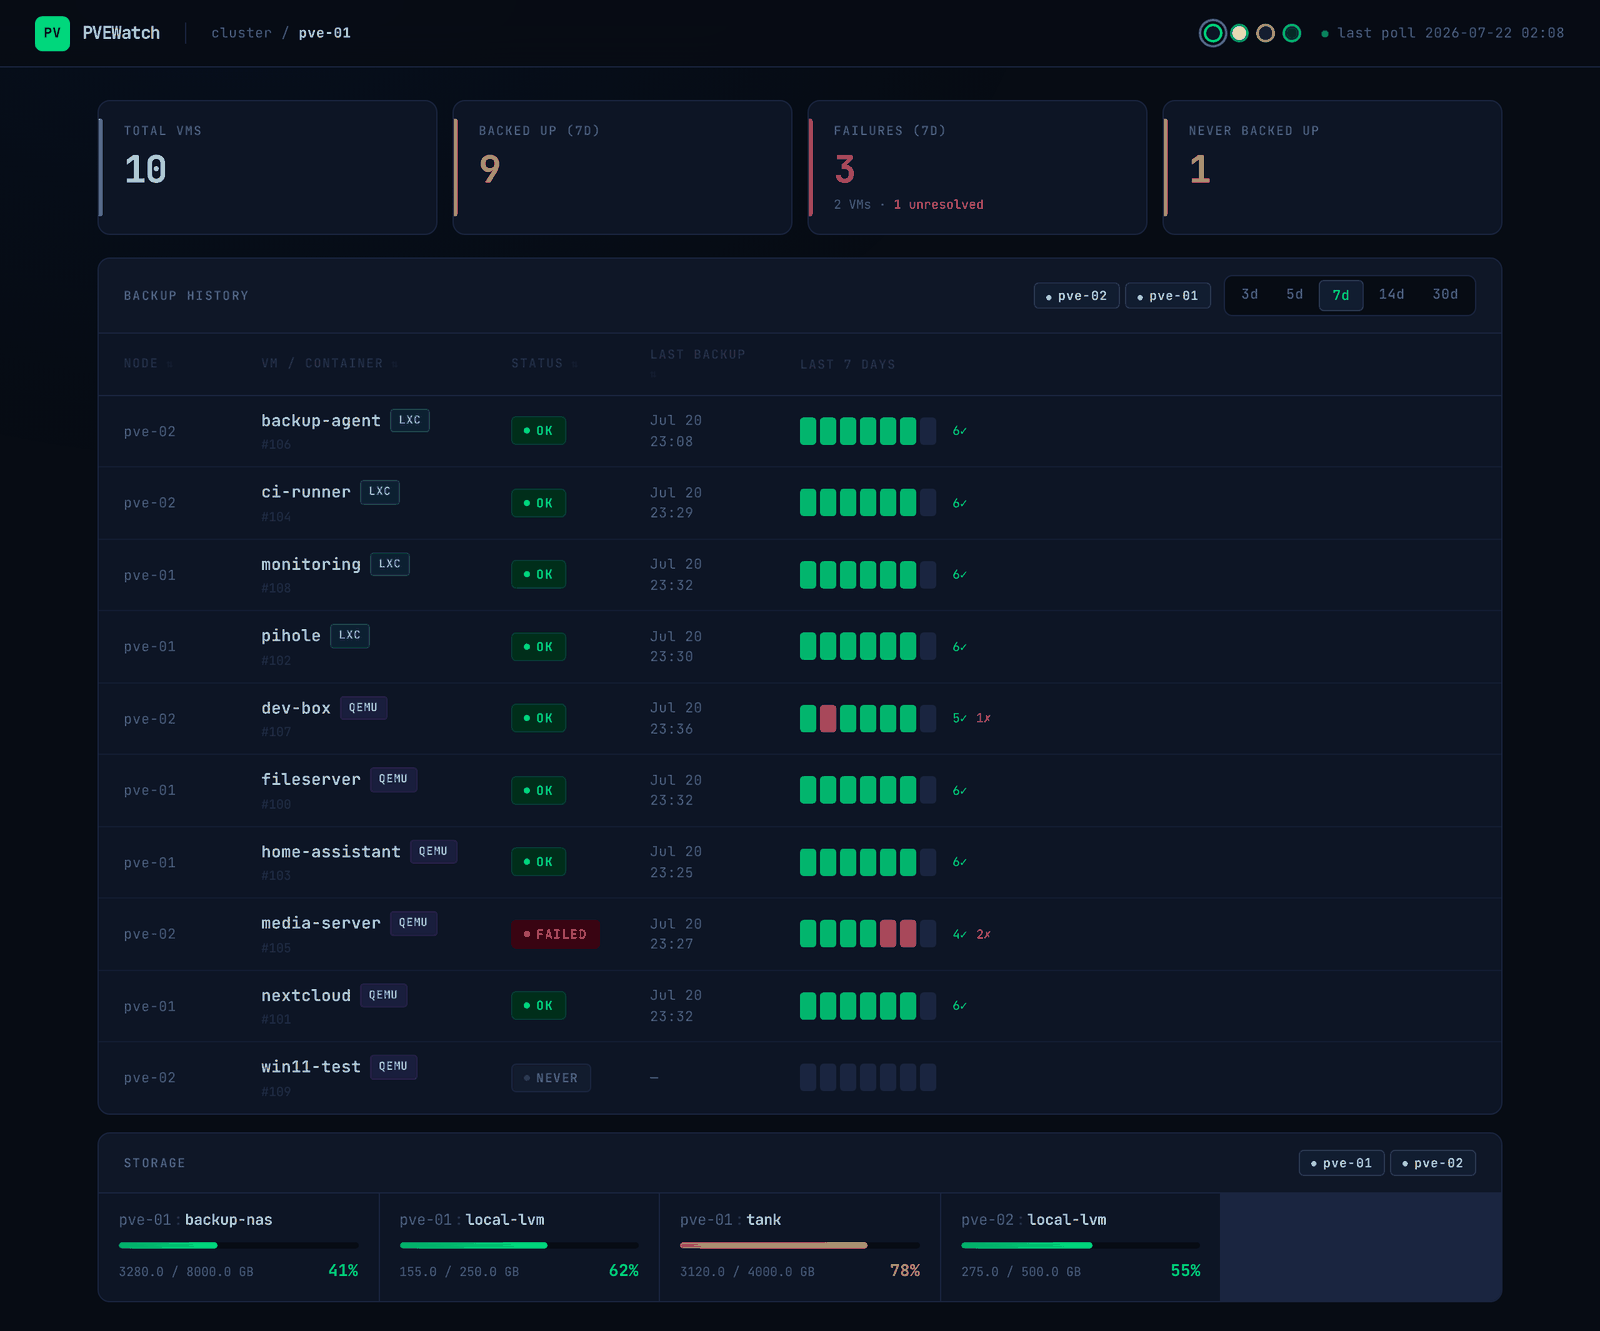
Run a backup job across a Proxmox cluster and you get one vzdump task. Inside it, sixteen guests each get dumped, compressed, and shipped, and each one succeeds or fails independently. What comes back out is a single task with a single exit status. If one container’s backup dies on a stale lock at 02:14, the job ends in an error state and the task log holds the reason — buried somewhere in a few hundred lines, next to fifteen successes.
Proxmox isn’t hiding this. Every per-VM result is right there in the task log, exactly where the API says it is:
INFO: Starting Backup of VM 104 (lxc)
INFO: Finished Backup of VM 104 (00:00:41)
INFO: Starting Backup of VM 105 (qemu)
ERROR: Backup of VM 105 failed - job failed with err -125 - Operation canceled
INFO: Starting Backup of VM 106 (lxc)
INFO: Finished Backup of VM 106 (00:01:07)
INFO: Backup job finished with errors
TASK ERROR: job errors
Two words at the bottom — job errors — is what the task list shows you. The identity of the guest that actually lost its backup is on line four of a log you have to go open.
What doesn’t exist is the rollup: a straight answer to which of my guests currently has no good backup. The web UI shows you tasks. You wanted to ask about guests.
Disclosure: I wrote the tool used as the example below. It’s free and MIT-licensed, and the argument stands on its own whether or not you ever run it.
Four moving parts to answer one yes/no question
The standard advice for homelab monitoring is a Prometheus server, an exporter, Alertmanager, and Grafana. That’s four services, three config languages, and a scrape interval to tune — in service of a question that fits in a sentence.
It’s worth being fair to that stack, because prometheus-pve-exporter is genuinely good and it does cover part of this. It exposes pve_not_backed_up_total: guests not covered by any backup job at all. That’s real, and it catches the VM you spun up in March and never added to the schedule.
But coverage isn’t outcome. Those are two different questions:
pve_not_backed_up_total        is this guest in a backup job?   → coverage
pvewatch_backup_last_status    did this guest's backup work?    → outcome
A guest that’s correctly configured, running nightly, and failing every single night is fully “covered.” It reports clean. The failure mode that actually loses your data — a job that exists, runs, and quietly doesn’t work — is the one the metric can’t see, because outcome lives in the task log and the exporter doesn’t read task logs.
Read the log, keep the history
The narrower approach: poll the task log directly, and when a task is a batch job, fetch the full log body and parse the per-VM lines out of it. Store the result per guest, per day. That’s the whole idea.
What it buys you is a history rather than a snapshot. Once outcomes are keyed by guest and date, “backed up 6 of the last 7 days, failed Tuesday” becomes a thing you can render — that’s the heatmap at the top of this post, and the row worth looking at is dev-box, one red square in a wall of green that no status page would ever have surfaced. “Hasn’t succeeded in nine days” becomes a thing that can page you. Alerts carry the last 20 lines of the failing task, so the notification contains the reason instead of an invitation to go log in and find it.
The cost is honesty about scope. It reads Proxmox and never writes to it — a read-only PVEAuditor token on / is the entire permission surface. It doesn’t monitor Proxmox Backup Server directly; it sees PBS-destined jobs the same way it sees any other, through the task log. And the per-VM parsing needs batch jobs to parse: if every guest has its own separate job, you get per-task results and none of the log-scraping matters.
The design decision I’d defend hardest is that it still exports /metrics. Per-VM backup status, last-success timestamps, failure counts — in Prometheus format. If you already run the four-part stack, this composes with it rather than arguing with it. It fills the outcome gap and lets Alertmanager do what Alertmanager is good at.
Monitor the thing from somewhere else
One rule that outlives any particular tool: don’t run your monitoring inside the cluster it monitors. A monitor colocated with its target reports beautifully right up until the outage that matters, then goes down with the ship and tells you nothing. Put it on the NAS, a Pi, a cheap VPS — anywhere with a different failure domain — and give it a heartbeat, so something external notices when it stops checking in.
The broader point is that the size of your observability stack should be set by the question you’re asking, not by what shows up first when you search for it. Prometheus and Grafana are the right answer when you have many questions, most of them numeric, most of them about trends. “Did last night’s backups work, and if not, which ones” is one question with a boolean answer, asked once a day. That deserves one container.
PVEWatch — MIT.